Anthropic has released the sixth edition of its Economic Index under the title Cadences, a study built on anonymized data from Claude usage. The name “cadences” apparently isn’t just marketing – for the first time, the research tracks AI usage not by the week but by the hour. The result is a vivid picture of when we turn to language models, what we take away from a conversation, and how we ourselves perceive AI’s impact on our work.
For anyone who works with AI professionally – whether deploying it for clients, building products on it, or simply thinking about where the market is heading – there are several points worth noting. Let’s walk through them together.
Methodology
Before we get to the numbers, a brief note on why the methodology had to change. A year ago, most Claude usage was a plain conversation between a human and an assistant. But with the arrival of Claude Code and Cowork, a session increasingly means long agentic tasks running in the background. A chat transcript simply no longer captures what’s actually happening, and the measurement methods had to keep pace.
So Anthropic did three things. It began sampling data far more densely, so it can see patterns down to the hourly level. It introduced a new classifier that assigns each conversation a type of output – a so-called artifact. And it started distinguishing between conversations in chat and Cowork on one side, and developer traffic through the API on the other. All the analysis runs through classifiers, where transcripts are read only by another instance of Claude, and cells with too few observations are filtered out for privacy. This is therefore an observation of the real behavior of millions of sessions, with all the advantages and biases that brings – and we’ll get to those.
When?
The first and perhaps most entertaining finding is that Claude usage faithfully mirrors the rhythm of human life. Work queries during the week, personal ones on the weekend.
Specifically: the share of conversations classified as personal use rises from roughly 35% on weekdays to nearly 50% on weekends. And it isn’t just about volume – the content changes too. On weekends, users shift from business correspondence, marketing copy, and presentations to emotional support, medical questions, and investment advice. This shift is largest in high-income countries. Monday morning, then, clearly belongs to emails; Sunday evening to reflections on life and one’s portfolio.
The hourly data goes one level deeper, and here the research turns into a kind of sociology of everyday life. People ask for the news at 7 a.m. local time. Business correspondence follows the arc of the workday, with a slight peak between 10 and 11 a.m. One of the biggest spikes belongs to recipes, which are 2.3× more frequent at 6 p.m. than on average – precisely the moment when someone stands over the fridge wondering what’s for dinner. Recommendations for films and series concentrate in the evening. And sleep advice peaks in the hours just before dawn, which is actually rather sad and very true to life.
The weekend shift in technical work is interesting too. With the coding tool Claude Code, the tasks that fall the most on weekends are backend architecture, API debugging, and data storage. The ones that rise the most, on the other hand, are AI agent design, quantitative trading, and game development. Weekends, in short, belong to hobbies even among programmers – only instead of work tasks, they’re building their own trading bot. Across countries, moreover, conversations about starting a business are most frequent on Saturday and Sunday.
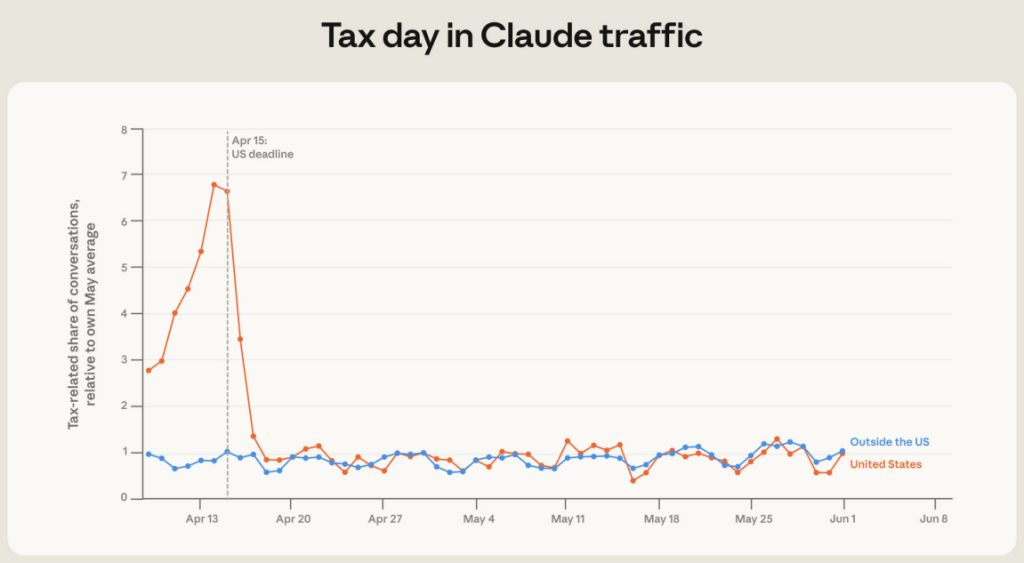
The tax season delivered one more finding as well. Around the U.S. filing deadline of April 15, the share of tax-related conversations spiked sharply – on April 14 they were eight times more frequent than on an average day in May, on April 15 they stayed roughly as high, and on April 16 they dropped.
Higher-paid professions grind away off the clock
And one more curiosity from the first chapter. At night and on weekends, when people do turn to Claude for work, the tasks shift toward highly paid professions. Tasks associated with occupations in the bottom two wage quartiles – like telemarketing or clerical work – fall to a smaller share. That makes sense.
Anthropic interprets it cautiously: it can’t determine the askers’ occupations with certainty, but the pattern is consistent with people in better-paid professions – marketing managers, programmers – more often working outside traditional hours. And it isn’t purely about IT fields: even when the researchers removed computer and mathematical occupations in a robustness check, tasks from the higher quartiles still rose at night and on weekends.
What?
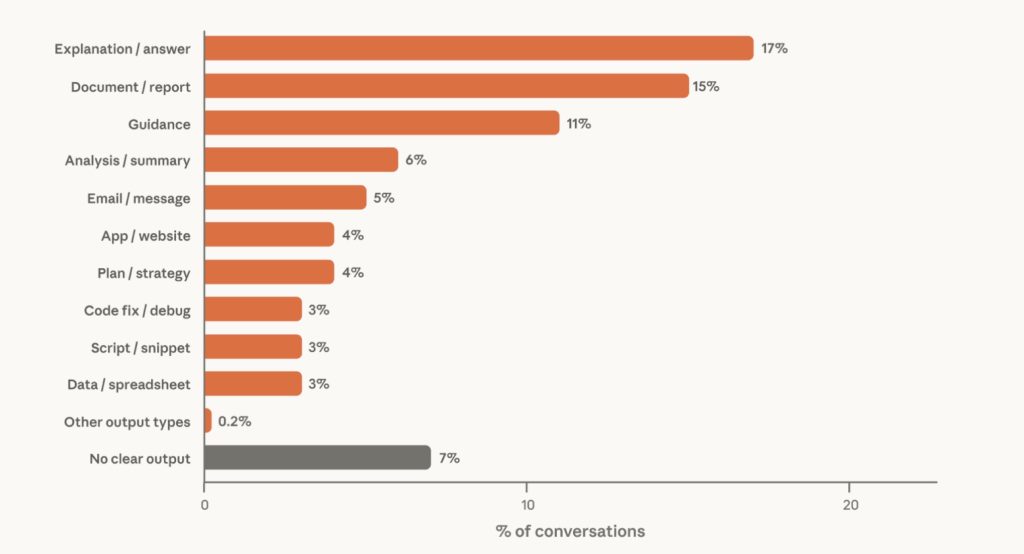
The new classifier sorted outputs into more than thirty categories and found that the most common are explanations (17% of conversations), work with documents and reports (15%), and guidance (11%). Grouped together: conversational outputs like explanations and guidance make up roughly a third, written outputs like documents and presentations also roughly a third, and code and technical work about a sixth.
The type of output alone, however, doesn’t tell you what it’s for. The same artifact can be both work and personal. Some categories are almost exclusively personal – over 80% of conversations producing creative writing, guidance, and recipes fall into the personal category. And even within a single category, personal and work use differ: personal creative writing is dominated by fanfiction, worldbuilding, and poetry, while the 13% of creative writing that is work-related is mainly short-form video scripts and speeches. The most work-related, by contrast, are creating marketing content (80%), blogs and articles (81%), and database queries (82%).
Pricier work = higher spend
The researchers correlated AI usage with compute – which, after all, is a substantial cost. It turns out this compute rises with the value of the work.
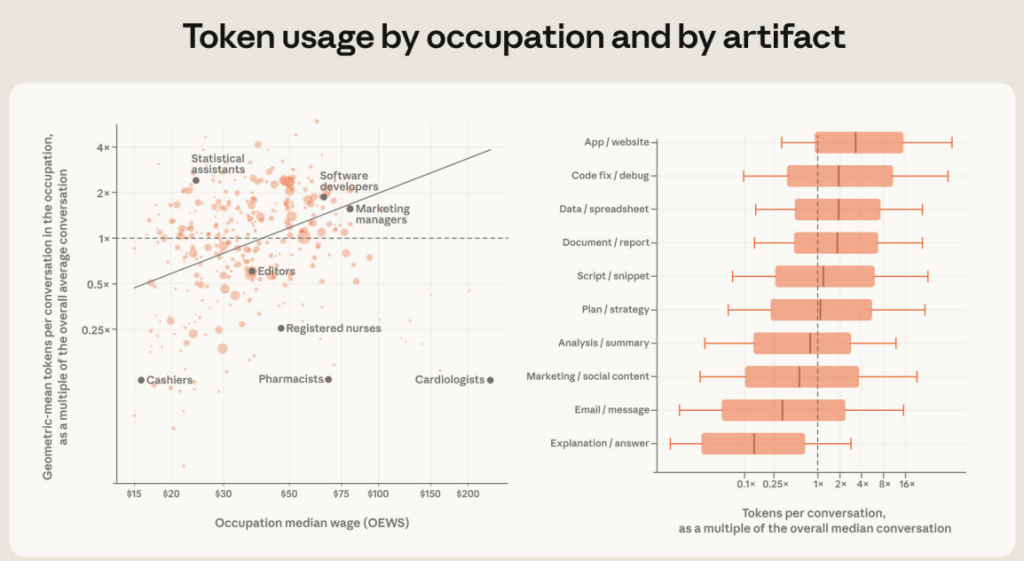
Anthropic measured each conversation’s cost in tokens – that is, the volume of text processed and generated, including the model’s internal reasoning – and mapped each task onto the occupation that typically performs it. The result is a positive relationship between the median number of tokens per conversation and the median wage in a given occupation. An example: marketing managers earn roughly twice what editors do ($80 vs. $37 an hour), and conversations mapped to their tasks consume about 2.5× more tokens.
The relationship isn’t perfect, of course, and has its exceptions – pharmacists, for instance, earn nearly three times what people in statistics and data roles do, yet their conversations consume only about a twentieth of the tokens. Even so, the trend is clear. The same pattern holds across output types: conversations about building apps consume over three times the tokens of the median conversation, while a typical explanation only about a fifth. Roughly 44% of the wage gradient in token consumption is explained precisely by the mix of outputs – better-paid professions more often produce compute-intensive artifacts.
So why does this matter? Because once we start talking about replacing work, it turns out that in conversations mapped to better-paid occupations Claude produces 1.34× more output per turn, and users engage more at the same time: 1.53× more often, and they also more frequently enable extended reasoning (34% of conversations versus 31%) – the so-called thinking model.
The pattern thus looks more like augmenting work than replacing it. Higher output value simply costs something, and that something isn’t just the machine’s compute, but the human’s attention too.
The report also introduces a scale of AI autonomy from 1 to 5 – from “none” to “extreme.” Low autonomy belongs to tasks that are easy to specify: math, translations, or questions and answers, where the result is essentially determined by what you write. High autonomy, by contrast, is required by tasks where the AI has to choose among many options, such as building an app, a website, a game, or a presentation.
What I find interesting is the choice of tool. The same task can have an entirely different degree of autonomy depending on where you set it. In almost all output types (26 of 31), the AI gets more latitude in the agentic developer tool Claude Code than in chat. That makes fair sense. An article illustrates it best. Whereas in chat you fine-tune it with Claude step by step, typically over thirteen rounds of back-and-forth, in Claude Code a single prompt is enough and the model steers the rest itself. Same result, but the second time the person just sets the task and waits. What’s interesting here is that the higher autonomy stems more from the tool than from agentic purpose as such. Cowork, though also agentic, is placed by the report – in terms of its degree of autonomy – with chat, not with Claude Code. Conversely, Cowork works more autonomously on data and spreadsheet work, which is likely because users usually keep data and spreadsheets stored locally, and that is precisely Claude Cowork’s domain.
One could object that the greater autonomy simply comes from Claude Code running more often on the most powerful model (54% versus 10% for chat and Cowork). But the difference persists even when we compare the same model. So it isn’t the “brain” underneath that decides, but the environment you work in – the interface itself determines how much work a person hands over to the machine. And precisely the same tasks where people delegate the most are the ones that consume the most tokens: autonomy and compute consumption go hand in hand.
How people perceive AI’s impact on their own work
The third chapter leaves the logs behind and, for the first time, asks people directly. In April 2026, Anthropic launched the Economic Index Survey and linked the responses to real usage data. The final sample comprises roughly 9,700 respondents.
Right at the outset, a caveat the report itself stresses: the sample is not representative of the general population. It is a random selection of Claude users, additionally filtered to exclude the least active ones. That is probably why computer and mathematical professions make up about 30% of respondents, many times more than their 4% share of U.S. employment. Management is likewise heavily overrepresented. Physical professions like transportation, food service, or construction are, by contrast, underrepresented. The figures below should therefore be read as the view of active AI users, not of society as a whole.
Most respondents expect significant AI progress over the coming year. Nearly 6 in 10 chose a higher capability band for next year than for today, and over a third expect AI to be capable of doing most or nearly all of their work tasks. Expectations about the pace of future progress are remarkably uniform. A software engineer and a construction manager expect roughly the same increment of progress in their field. The report links this to the notion of a “rising tide,” where AI’s capabilities improve across the board.
Perception of current capabilities, meanwhile, declines with experience. People with at least 15 years of practice estimate the share of tasks AI can handle roughly 10 percentage points lower than those in their first year. The reason, according to follow-up questions? Experienced workers have accumulated tacit, context-specific expertise that AI struggles to imitate. They most often noted that AI lacks judgment, contextual awareness, and situational reasoning – and disproportionately often pointed to the relational and interpersonal dimensions of work, such as building trust and managing people.
Concerns about employment are mild and, above all, asymmetric. Ten percent rate the loss of their own job as likely, which is slightly below the actual annual layoff rate in the U.S. But on average respondents were more worried about others’ jobs than their own. Most of all about junior colleagues, where over a third estimated the probability of losing a position at over 60%. The tendency to see one’s own situation in rosier terms than others’ is, after all, a well-known human inclination (the Lake Wobegon effect).
Those who delegate most are the most optimistic
What is, in my view, the least intuitive finding of the whole report? There’s a common fear that people who hand entire tasks over to AI will be the most terrified of being replaced by it. The data show the exact opposite. Across all six dimensions examined – wage, job security, ability to find a new job, meaning, autonomy, and human interaction – people with a higher share of automated sessions are more optimistic about AI’s impact on their work than those who use Claude more collaboratively. The largest effects appeared in expectations about future wages and the ability to find a job.
Why this is, the report doesn’t say with certainty, but it offers two explanations. Either delegation is informative: whoever hands over a whole task sees with their own eyes what AI can manage on its own. Or people who already believe in AI’s capabilities are simply more willing to hand work to it. These estimates, moreover, don’t change substantially even after accounting for length of AI use, which can be taken as a proxy for enthusiasm.
Related to this is the question of learning and thinking. A frequent fear is that handing entire tasks to AI means switching off one’s own thinking, with output growing at the expense of learning and skill atrophy. The data don’t confirm this pattern: people who delegate heavily report learning just as much as others, and the share of those who feel AI increases the market value of their skills actually rises with the degree of automation. Again, though, this is users’ self-assessment, and skills can erode even when a person perceives them as more valuable. See the aforementioned Lake Wobegon.
What to take away?
The report paints a fairly coherent picture. AI is spreading rapidly through the economy, across a growing number of interfaces and with ever more intelligent outputs. Whereas the first users were highly technical, the newest ones deploy Claude on tasks with lower wages in the labor market.
Several things follow for practice. More valuable outputs cost more compute and more human attention at the same time – so it isn’t about replacing the human, but pairing them with AI precisely where the most value is at stake. The way of working, moreover, matters more than the model: the same model behaves more autonomously in an agentic tool than in chat. And finally, the people closest to the frontier of AI’s capabilities fear it the least, which is perhaps the most important message for anyone still merely contemplating deploying AI in their company.
The real impact on the economy will very likely show up, in the end, in aggregates like employment and productivity as much as in the usage records being tracked. But until that happens, watching these shifting patterns is one of the few ways to see where things are heading – and that, at the very least, makes it worth a read.
Source: Anthropic Economic Index report: Cadences, 26. 6. 2026. – Download